Global FLNG Intelligence
Advanced tracking of Floating Liquefied Natural Gas (FLNG) infrastructure, operational units, and regional development projects.
Floating Asset Class
Interactive Intelligence
This dashboard dynamically aggregates data for global floating terminals. Select any project card to view technical specifications, operator profiles, and latest milestones.
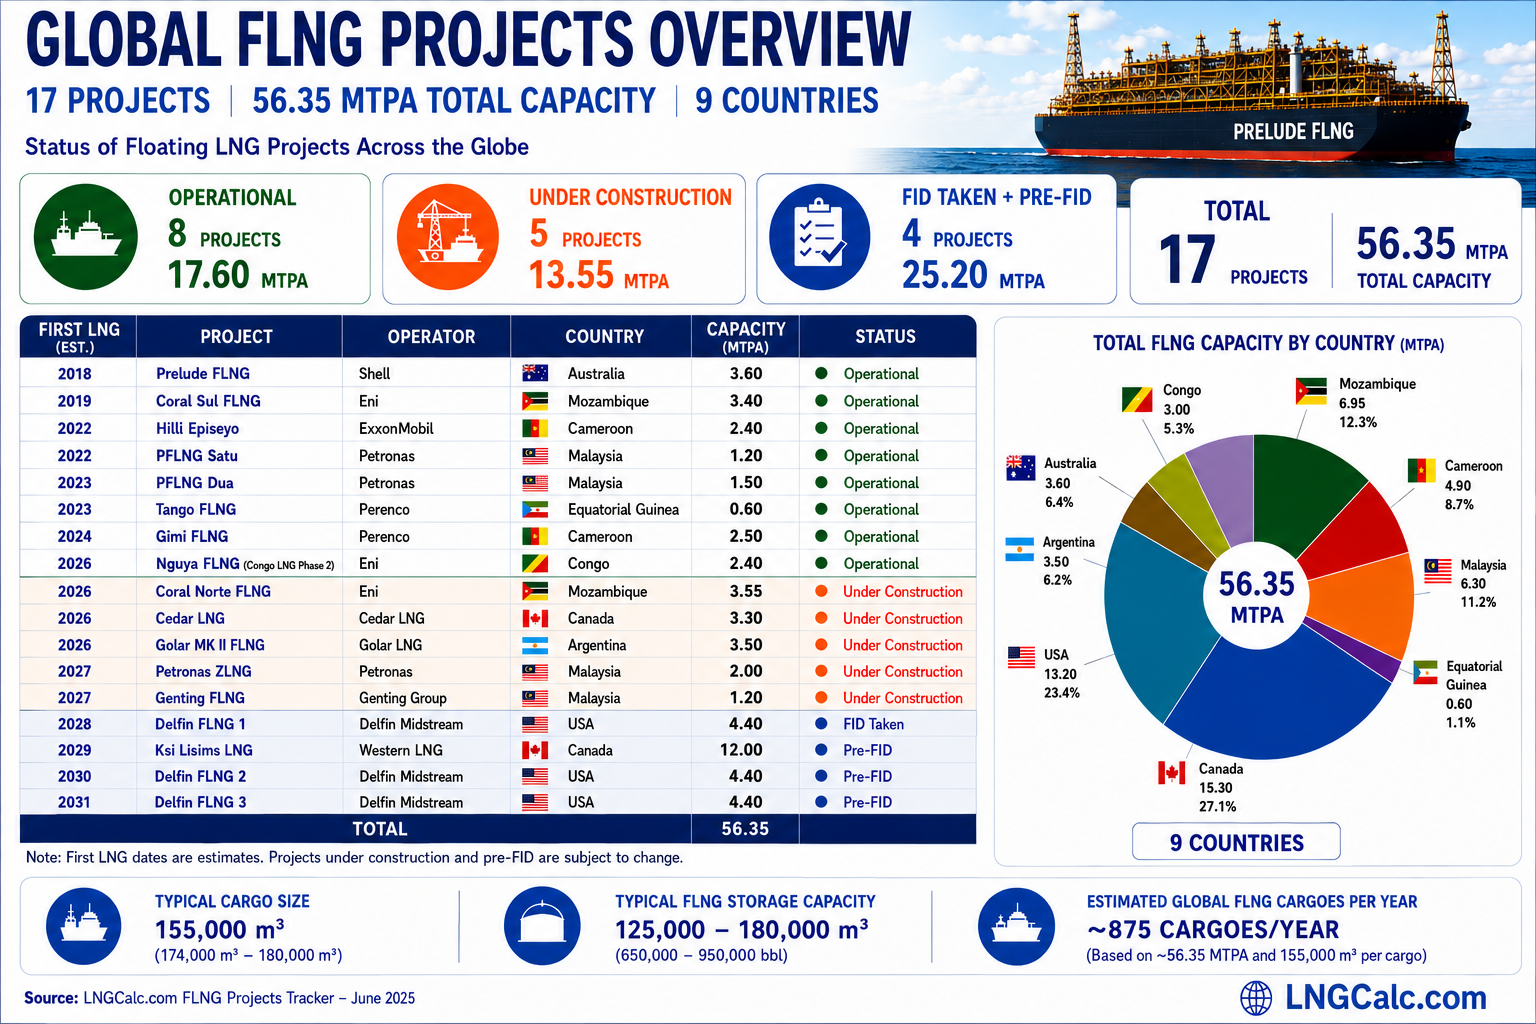
Operational
8 Projects
17.60 MTPA
In Construction
5 Projects
13.55 MTPA
FID / Pre-FID
4 Projects
25.20 MTPA
Total Expected Capacity
56.35
MTPA Aggregate
Global FLNG Asset Ledger
| Year | Project Name | Country | Capacity | Status |
|---|---|---|---|---|
| 2018 | Prelude FLNG | Australia | 3.60 | Operational |
| 2022 | Coral Sul FLNG | Mozambique | 3.40 | Operational |
| 2018 | Hilli Episeyo | Cameroon | 2.40 | Operational |
| 2017 | PFLNG Satu | Malaysia | 1.20 | Operational |
| 2021 | PFLNG Dua | Malaysia | 1.50 | Operational |
| 2024 | Tango FLNG | Republic of Congo | 0.60 | Operational |
| 2025 | Gimi FLNG | Mauritania / Senegal | 2.50 | Operational |
| 2026 | Nguya FLNG | Republic of Congo | 2.40 | Operational |
| 2028 | Coral Norte FLNG | Mozambique | 3.55 | Under |
| 2028 | Cedar LNG | Canada | 3.30 | Under |
| 2028 | Golar MK II FLNG | Argentina | 3.50 | Under |
| 2028 | Petronas ZLNG | Malaysia | 2.00 | Under |
| 2026 | Genting FLNG | Indonesia | 1.20 | Under |
| 2030~ | Delfin FLNG 1NEW FID | USA | 4.40 | FID Taken June 2026 |
| 2031 | Ksi Lisims LNG | Canada | 12.00 | Pre-FID |
| 2031+ | Delfin FLNG 2 | USA | 4.40 | Pre-FID |
| 2032+ | Delfin FLNG 3 | USA | 4.40 | Pre-FID |
Capacity by Nation
Canada27.2%
USA23.4%
Mozambique12.3%
Malaysia8.3%
Australia6.4%
Argentina6.2%
Republic of Congo5.3%
Mauritania / Senegal4.4%
Cameroon4.3%
Indonesia2.1%
Global Development Pipeline
Operational
31.2%In Construction
24.0%FID / Pre-FID
44.7%LNG Vessel
155,000 m³
Standard Range
Storage Capacity
180k - 326k m³
Onboard Inventory
Annual Activity
~875 Cargoes / Yr
Est. Global Flow
Data Fidelity
Infrastructure status is verified against company filings and satellite tracking of commissioning milestones.
Technical Scope
Covers the full FLNG value chain from near-shore units to deep-water hull-integrated liquefaction vessels.
Asset Tracking
Updated tracking for offshore Africa, Western Australia, and US Gulf Coast offshore concepts.